BI Pixie can instrument your target reports using three methods:
- Manually or externally: You bring your reports and semantic models locally, then you run BI Pixie Instrumentation using the target folder. This method is documented here.
- Using Git: You connect BI Pixie Instrumentation with your Git or GitHub repository. BI Pixie Instrumentation will pull the definitions of your reports and semantic models and can even commit and push the instrumented items in the repository and the Power BI workspaces that are integrated with Git. This method is documented here.
- Via Microsoft Fabric API: You tell BI Pixie which workspaces and reports to use. BI Pixie will load the definitions of the reports and semantic models (Using Get Item Definition API call) and will store the files locally. Then, BI Pixie will instrument the reports and semantic models and update the report definitions in their corresponding workspaces.
In this article, you learn how to instrument your reports using the 3rd method which can help you streamline BI Pixie instrumentation into your existing report deployment process by connecting to your Power BI service via Fabric API.
Before you start
- Make sure you first define all the mandatory configuration parameters as described here.
- Before you start the instrumentation for the first time, install Azure CLI for Windows on the machine where you run 'bi-pixie.exe' and log in to Azure using 'az login' before you run the instrumentation.
How Does It Work
You can connect BI Pixie Instrumentation to Microsoft Fabric / Power BI service to automatically export the definitions of your reports and semantic models, and import back the instrumented items into your workspaces.
First, you will tell BI Pixie which workspaces to use. Then, you can specify which reports to include or exclude. BI Pixie will load the definitions of the reports and semantic models (Using Get Item Definition API call) and will store the files locally. Then, BI Pixie can instrument the reports and semantic models locally and even update the changes in the workspaces.
Instrumentation Setup
- Open
bi_pixie_configuration.jsonfile. Make sure that you have already configured the mandatory parameters, as described here. - Set
use_report_folder_as_projectastrue. - Under
fabric_settings, find the parameters below and set them totrue:enable_workspace_contextauto_mapping_folders_to_workspacesload_items_using_fabric_apisave_items_using_fabric_api
- Optionally, if you want to test the instrumentation locally first after the items are loaded, and skip the service update of the instrumented definitions to a later time, keep
save_items_using_fabric_apiasfalse. - Use the workspace and report parameters to define which workspaces and reports to include or exclude, as explained in this table:
| Parameter Name | Description | Example |
include_all_workspaces | When set to false, you can include the list of workspace IDs you want to use in the include_workspace_ids array parameter below.When set to true (Not recommended due to API limits), BI Pixie will read the item definitions of reports and semantic models from all workspaces, except the workspaces you exclude in exclude_workspace_ids array. | "fabric_settings": { |
exclude_workspace_ids | Use this array parameter, when include_all_workspaces is set to true. It will allow BI Pixie to read meta data from all the workspaces excluding the specified ones. | "exclude_workspace_ids": [ |
include_workspace_ids | Use this array parameter, when include_all_workspaces is set to false. It will allow BI Pixie to read meta data from the specific workspaces and avoid reading all the workspaces in the tenant.If you use Power BI Deployment Pipelines, it is recommended to include here only the Test workspaces. | "include_workspace_ids": [ |
include_all_reports | When this Boolean parameter is set to true, BI Pixie will read meta data from all the reports in the target workspaces that were defined above.When set to false, you will have to include the list of workspace IDs in the include_report_ids array parameter below. | "fabric_settings": { |
exclude_report_ids | Use this array parameter, when include_all_reports is set to true. It will allow BI Pixie to read meta data from all the reports in the target workspaces excluding the specified ones. | "exclude_report_ids": [ |
include_report_ids | Use this array parameter, when include_all_reports is set to false. It will allow BI Pixie to read meta data from the specific reports and avoid reading all the reports in the target workspaces.Note: No need to define the semantic model IDs. | "include_report_ids": [ |
- Run
bi-pixie.exe. - You can find the local instrumented reports under BI Pixie Repository sub folder. Read this article to learn how to test the reports before you publish them. Note that you may need to refresh the reports first if you open them locally.
- If you set
save_items_using_fabric_apiastrue, you can now open the reports in the Power BI service and confirm that usage is tracked.
Every time you make changes in your reports, you can run BI Pixie Instrumentation in the same setup. BI Pixie will delete the local folder time you run the instrumentation.
Using Deployment Pipelines
If you use the Deployment Pipelines in Power BI, you can set BI Pixie to load the definitions from your Test stage while keeping the original reports in the Development stage. After you run BI Pixie, you can test the reports in the Test workspace in Power BI Service and then deploy them in the Production stage using the Deployment Pipeline feature in Power BI.
The following diagram illustrates how you can instrument BI Pixie as part of your existing process using Power BI Deployment Pipeline.
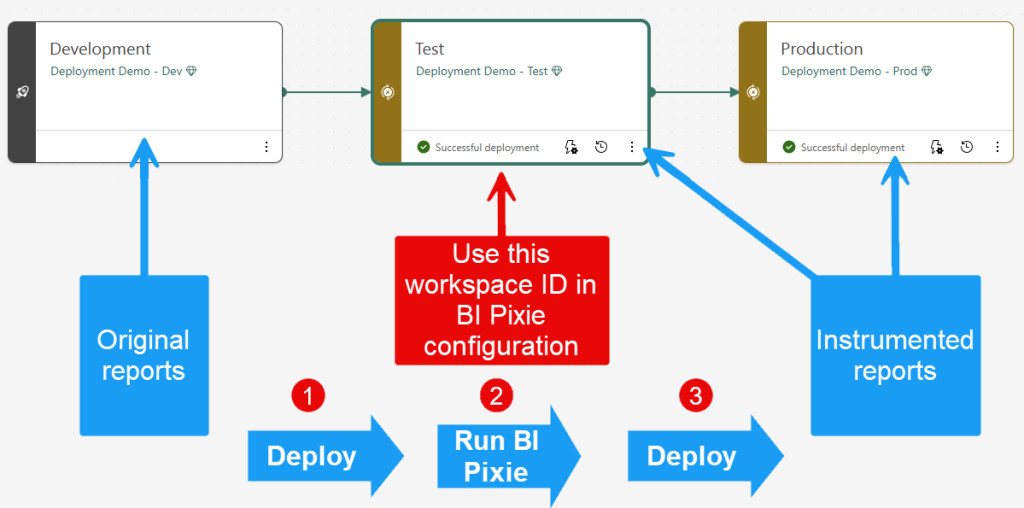
You can follow these steps for each deployment pipeline:
- Get the workspace ID of the workspace that is assigned to your Test stage. You can do it by browsing to the workspace from the Test stage in the deployment pipeline page. In the workspace page, find the Workspace ID in the URL address bar in the browser. For example, here is the highlighted workspace ID:
https://app.powerbi.com/groups/xxxxxxx-xxxx-xxxx-xxxx-xxxxxxxxxxxx/list?experience=power-bi. - Add the workspace ID in the
include_workspace_idsparameter. You can optionally exclude or include individual report IDs as well. - Every time you have changes in the original reports in your Development stage, deploy the changes to Test stage using the user interface of Power BI Deployment Pipelines (or APIs). This step is highlighted as step 1 in the diagram.
- Run BI Pixie Instrumentation. It will load the definition files of your reports from the Test workspace and update back the instrumented items. This step is highlighted as step 2 in the diagram above.
- Test the reports in the Test workspace.
- Deploy the instrumented reports from Test to Production using the user interface of Power BI Deployment Pipelines (or APIs). This step is highlighted as step 3 in the diagram above.