Telemetry & Intelligence for Power BI
See How People Actually Use
Your Power BI Reports
The only pixel-tracking solution for Power BI. Visual-level heatmaps, click-level auditing, RLS flaw detection, user feedback, and embedded surveys. Set up in minutes.
Free 14-day trial · No credit card needed
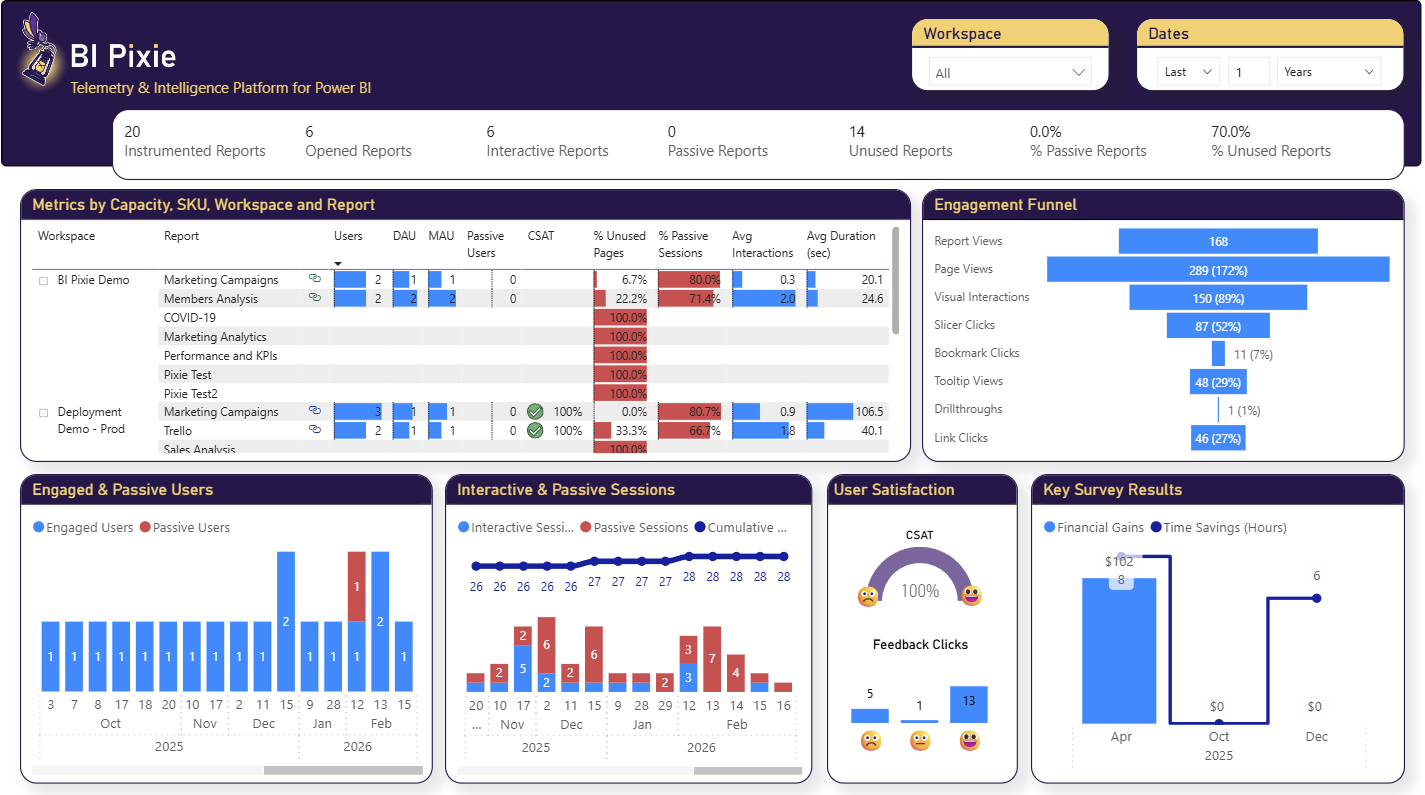
Adoption and engagement at a glance
See it in action
Watch the BI Pixie demo
See how BI Pixie adds invisible tracking Pixies to your Power BI reports and turns real usage into adoption, engagement, and satisfaction insights.
Key Features
Everything you need to understand your Power BI audience
Go beyond native Power BI usage metrics. Track what matters for report optimization, governance, and ROI.
Measure ROI
Measure the ROI of your BI investment through the lens of user adoption, engagement, CSAT and NPS scores.
Zero Deployment
Nothing to deploy. Sign up, connect your Power BI workspace, and start tracking in minutes. We handle the infrastructure.
Your Data, Your Control
Your data is stored in a dedicated, isolated container. Encrypted at rest and in transit. Self-service deletion and configurable retention for GDPR compliance.
Beyond Page Views
The only solution that tracks engagement and interactions, not only page views. Achieved through invisible pixel-tracking elements native to Power BI.
Enterprise Scale
Built for large organizations. Assign licenses to business units for chargeback to cost centers, with dedicated isolated storage per team. Scale effortlessly as your Power BI portfolio grows.
Adoption & Attrition Metrics
Measure user adoption and attrition like a pro with dozens of KPIs and time-intelligence metrics.
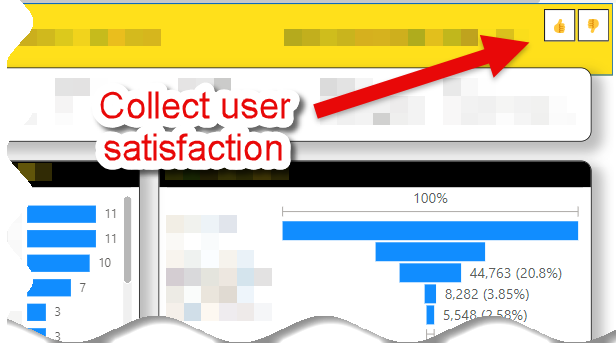
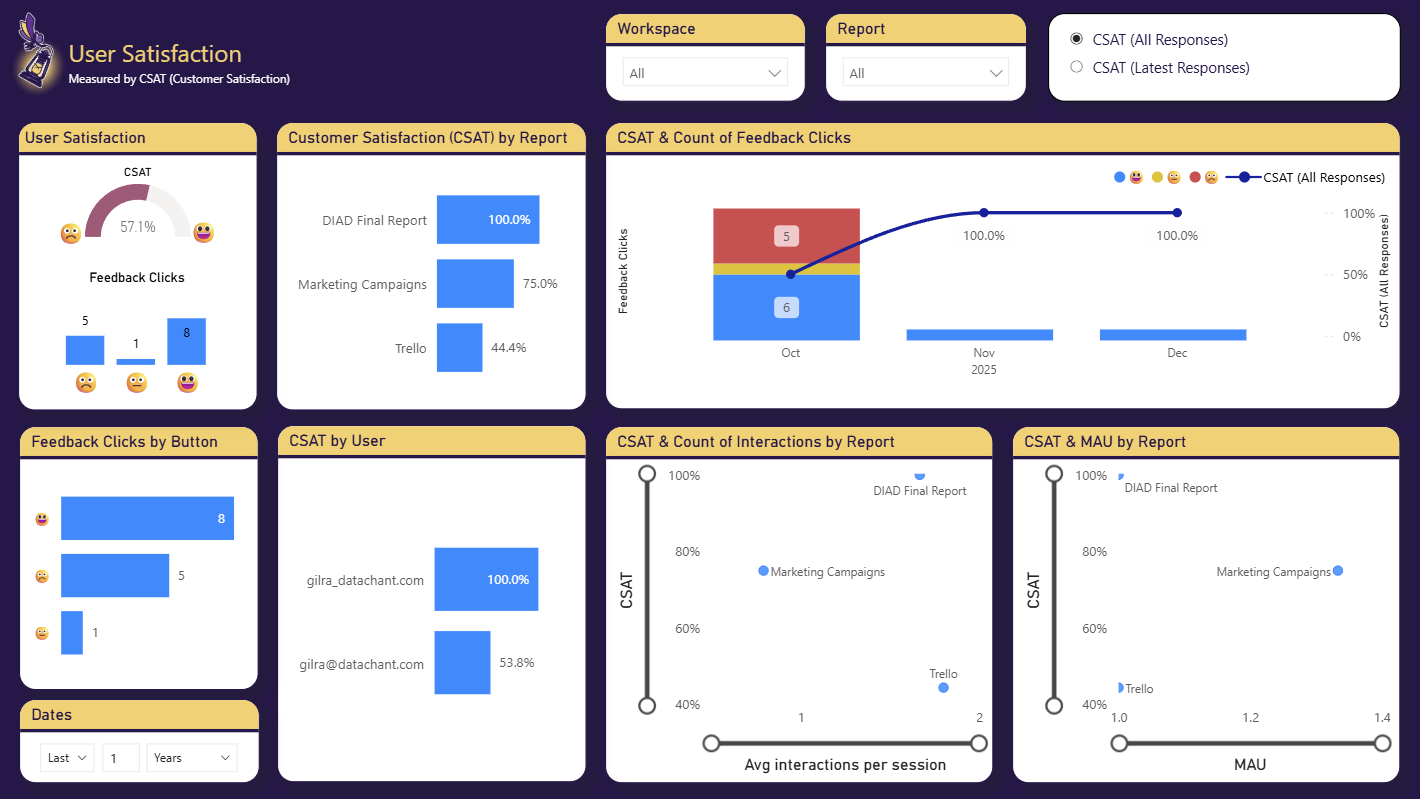
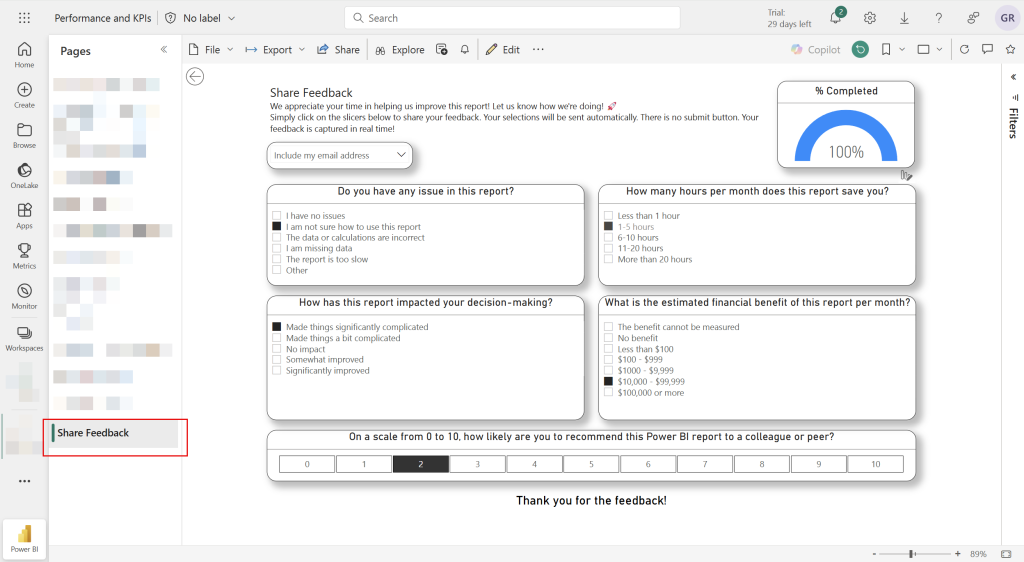
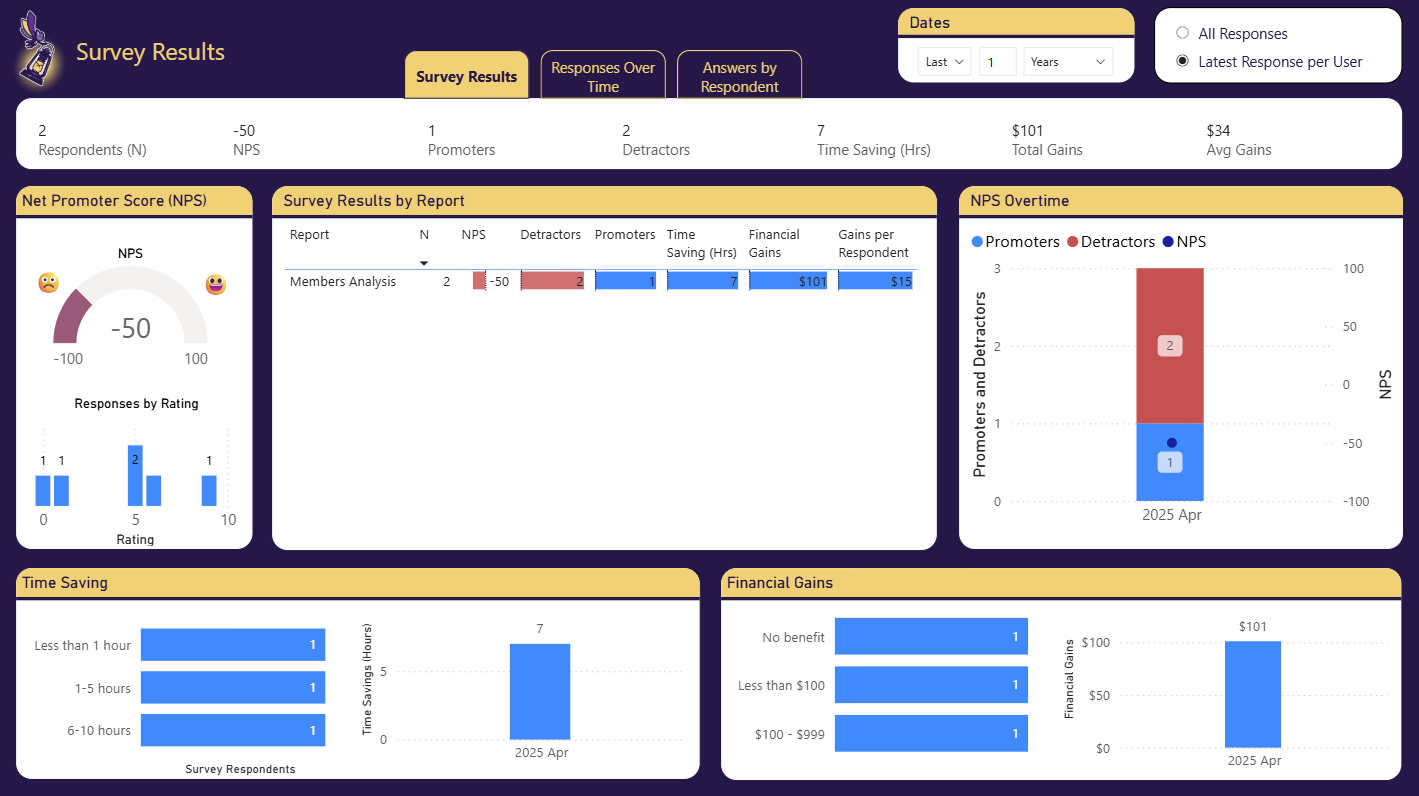
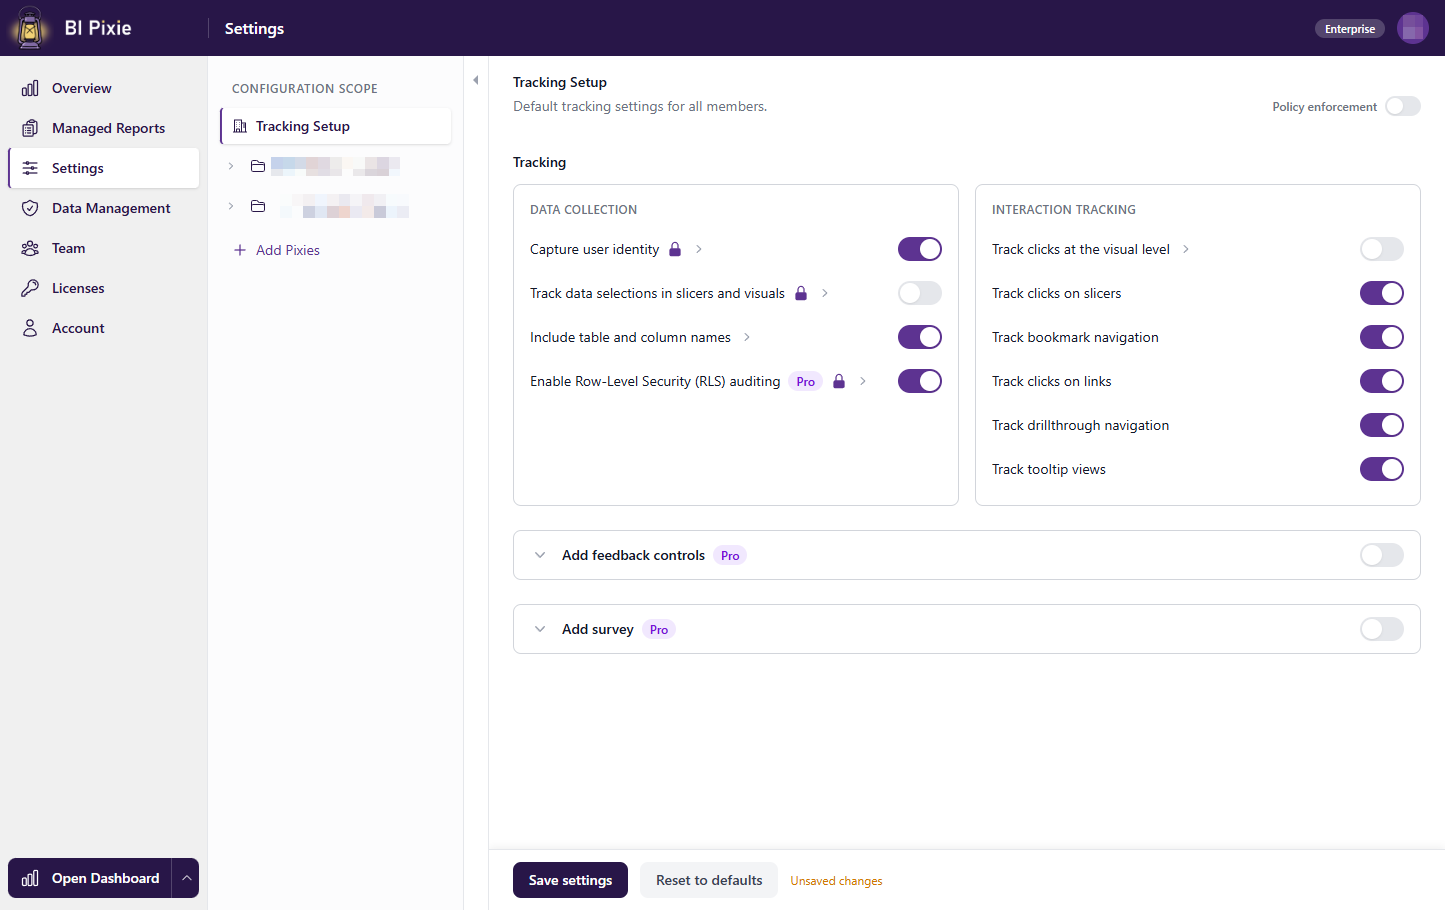
User Satisfaction
Automatically add feedback controls (Thumbs-up/down or Smile/frown) and embedded survey to measure user satisfaction.
Design Impact
Rank the designs of reports by complexity, usability and passivity and analyze their impact on user engagement & satisfaction
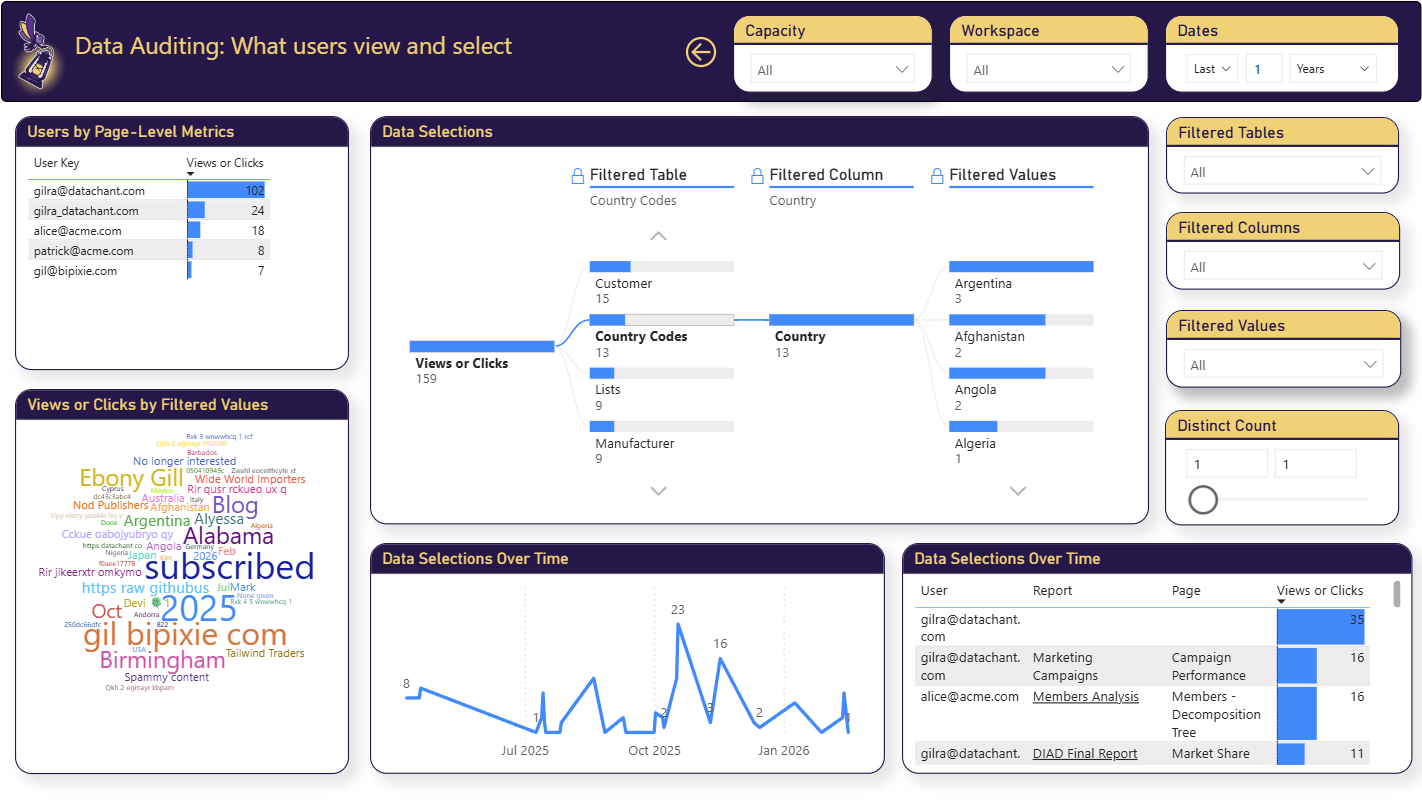
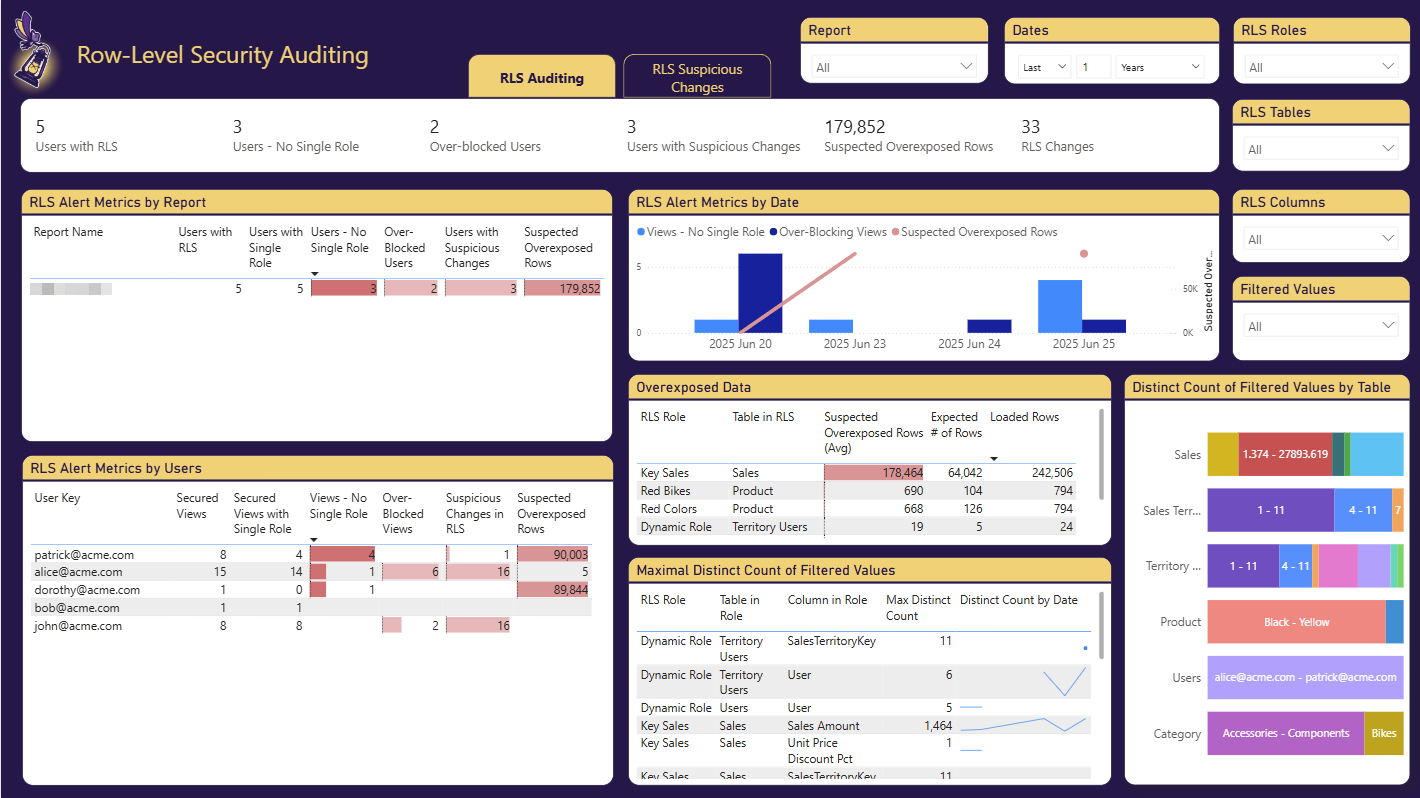
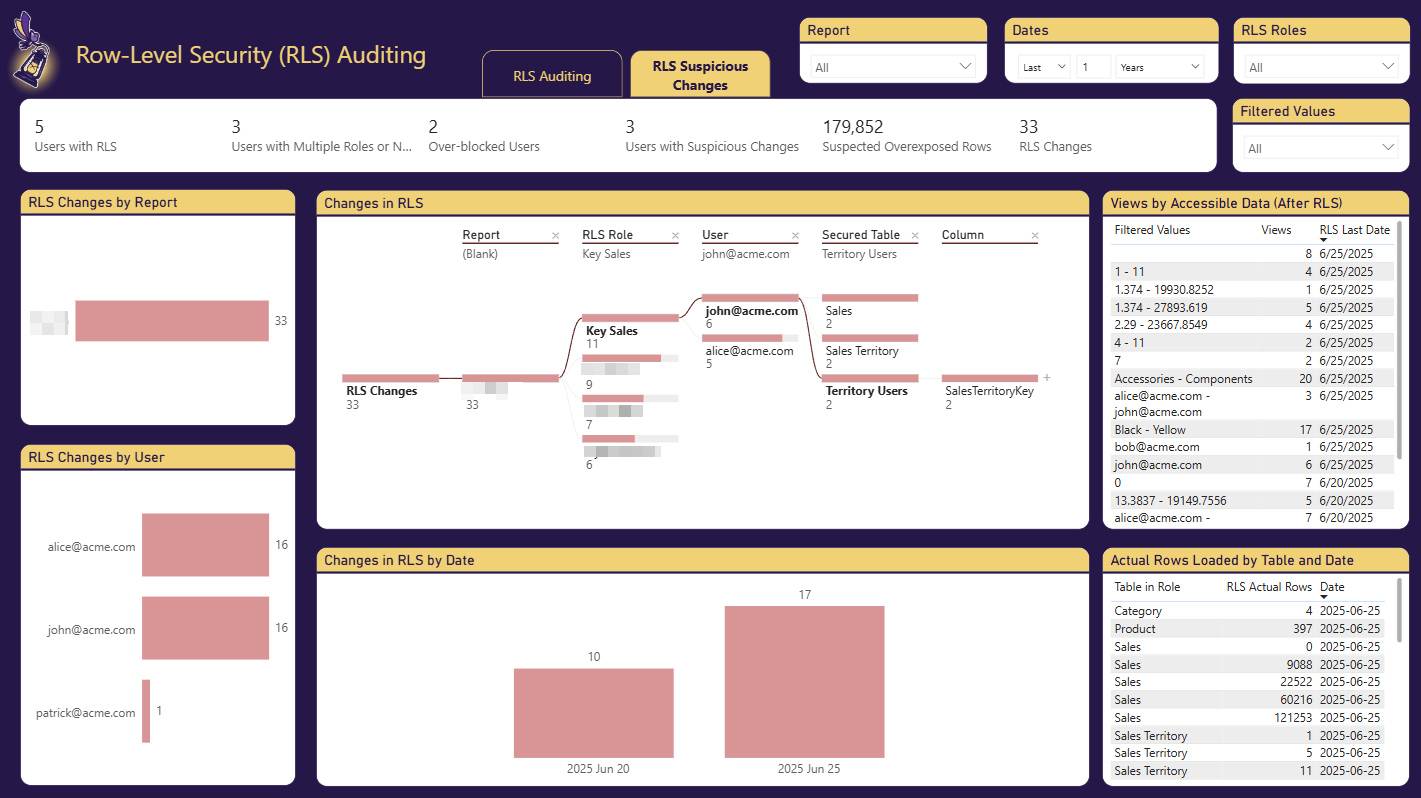
Security & Data Governance
Audit row-level security misconfigurations and track user activity across reports. Detect data access anomalies and ensure compliance with your organization's data governance policies.

Trusted by Power BI Teams Worldwide
Built by DataChant Consulting · Microsoft ISV Partner · Leading Publisher of Power BI Apps
Use Cases
Real challenges. Real solutions.
AI Is Here. Which Dashboards Should It Replace?
- Scenario: AI agents are transforming how organizations consume data. Whether it is Copilot in Power BI, agents in Microsoft Fabric, or standalone AI tools, your leadership expects you to have a plan. The question is no longer if AI will change your BI portfolio, but which reports to augment or retire first.
- Challenge: You have hundreds or thousands of Power BI reports and no clear way to prioritize which ones are candidates for AI-driven experiences. Some reports may be heavily used but simple enough for an AI agent to replace. Others may be underused because they are hard to navigate. Without engagement data, you are guessing, and guessing wrong means wasted AI investment or disrupting workflows that your users depend on.
- Solution: BI Pixie gives you the engagement intelligence to make confident AI decisions. You can identify low-engagement reports that are candidates for retirement, high-interaction reports where AI copilots can reduce manual filtering and drilling, and complex dashboards where users struggle. With data on session duration, click patterns, and user adoption trends, you build an AI roadmap grounded in how people actually use your reports today.
Are You Successful With Your Mission-Critical Reports?
- Scenario: You made it! Your team delivered mission-critical Power BI reports that drive informed decisions and replace legacy reports.
- Challenge: The adoption seems to be low, and your organization keeps using the legacy reports. You are not sure why, or sure how to make your reports better.
- Solution: With BI Pixie you gain back control and measure user adoption like a pro.
Your BI Team Is The Best!
- Scenario: You own the delivery of mission-critical reports and lead an amazing team of Power BI subject-matter experts.
- Challenge: Your team gets frustrated. An endless flood of change requests in your backlog is difficult to prioritize without empirical data on usage and engagement. The team spends too much time on repetitive tasks without certainty that they make the difference.
- Solution: With BI Pixie, the team finally knows where to invest. Prioritization is easy and the impact of the team is measurable. The team is happy again.
It Is A Political Game
- Scenario: You have invested a lot of effort and budget in delivering executive dashboards on Power BI that serve the C-level team.
- Challenge: You receive mixed feedback about your reports from stakeholders that tend to disagree with your strategic direction. You feel that you must act fast and prove success. But how?
- Solution: With BI Pixie you can see how your C-level audience engages with the reports. With best-of-breed engagement metrics on user adoption and attrition you reach out to executives with evidence of what's good and what's bad. They even ask you to develop such analytic capabilities for their product line.
Where Is The ROI?
- Scenario: Your organization invested 7 figures this year to deliver Power BI reports. It is not only the license costs, but the headcount of contractors and internal staff.
- Challenge: The return on investment is not clear. It is not simple to measure it on thousands of reports. The single dimension of page views is not giving you the entire picture and you are looking for a way to measure the success. But time is short. Your budget next year is at risk without clear ROI measurements.
- Solution: BI Pixie is your game-changer. You finally get the data you have been looking for. The ROI of thousands of reports can be measured with engagement metrics that include monthly active users, average interaction per session and session duration. You can better plan the areas of investment for next year and how to allocate the BI budget in your organization.
Cut Capacity Costs. Speed Up The Reports That Matter.
- Scenario: Your Power BI Premium or Fabric capacity bill keeps climbing. Finance is asking hard questions, and you are under pressure to reduce spend without breaking the reports the business actually depends on.
- Challenge: Native capacity metrics tell you which datasets and reports consume the most CUs, but not which ones are worth the spend. Some expensive datasets back the executive reports the C-suite opens every day. Others refresh on the hour for content that has not been viewed in months. Slow visuals frustrate your heaviest users but feel invisible from the capacity side. Without engagement data tied to cost and complexity, every cut is a gamble, and trimming the wrong dataset can break a workflow you did not know existed.
- Solution: BI Pixie pairs your capacity spend with real engagement data. You can spot reports that burn CUs with zero recent users and complex dashboards where session duration collapses because users abandon early. Cost cutting becomes evidence-based: retire the unused, tune the slow ones your top audience fights with daily, and protect the reports that drive the business. Performance optimization stops being guesswork and starts being targeted at the visuals people actually use.
The Never-Ending Migration
- Scenario: You supervise a multi-million multi-year migration plan of tens of thousands of legacy and modern BI reports to Power BI. The project is underway, and the delivery is gradual.
- Challenge: Business stakeholders keep sending change requests for many weeks after the acceptance test is complete. Your BI teams and vendors spend too much time on maintenance instead of moving to the next migration cycle. They are behind schedule, and you feel that the entire migration can fail.
- Solution: BI Pixie helps you measure the effectiveness of your BI team through user engagement of their reports. You find better ways to prioritize the maintenance work and plan the next phases of the migration. Now, your BI teams start with the delivery of semantic models and the line-of-business teams create the reports and data visuals. With BI Pixie you monitor the engagement of the business users and can know in advance what works better, and which reports need the attention of your teams.
Your "Google Analytics" for Power BI Embedded
- Scenario: You offer a web app to your customers with Power BI embedded. It is crucial that your app delivers the best experience for your customers.
- Challenge: Unlike other parts of your web apps, it is difficult to track the user engagement. There is no "Google Analytics" type of analytics, and you have no clue where the users stay longer in the embedded report or on what they click. Without visibility to your users, you don't know what to improve. You start to ask if the investment in Power BI was the right choice. Your business relies on the analytics capability within the app, so time for decisions is critical.
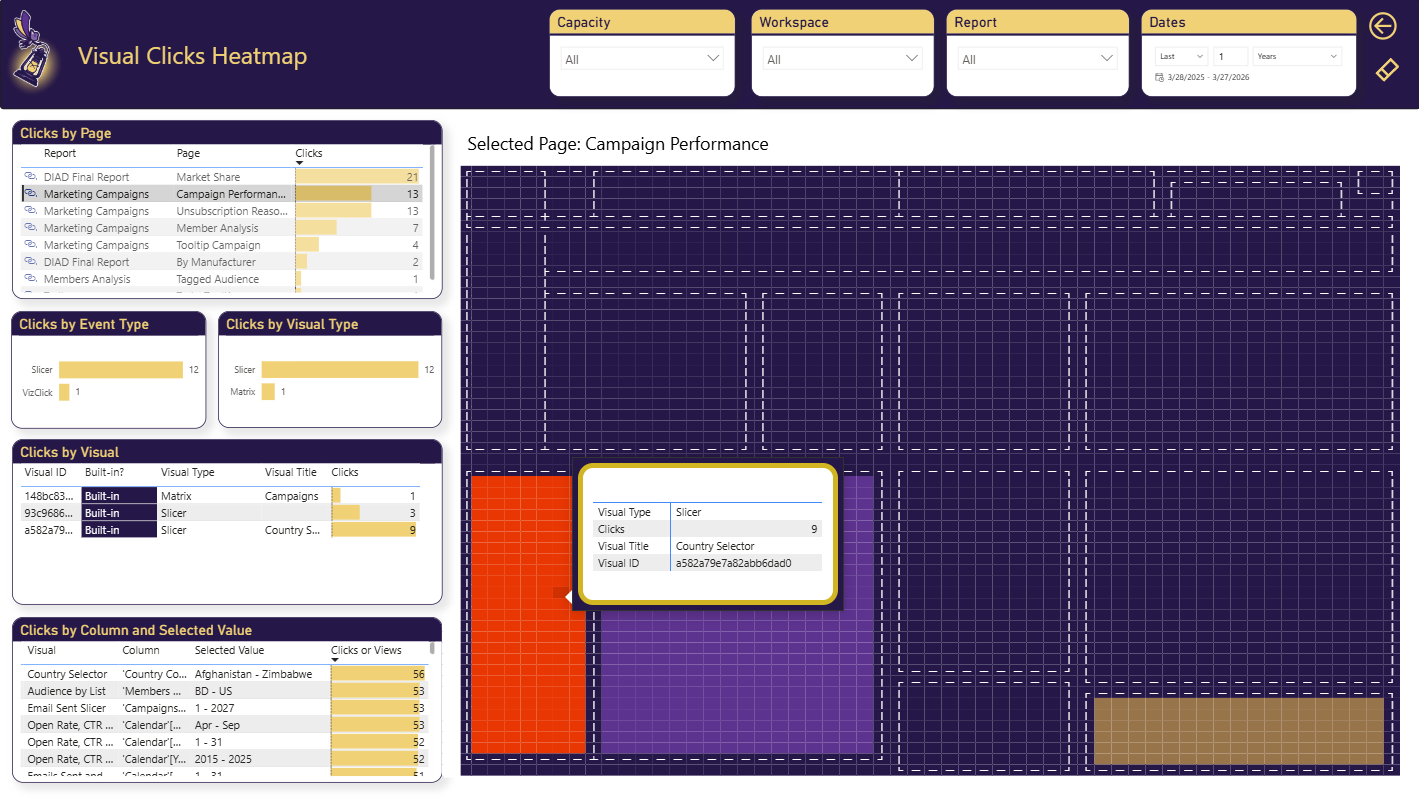
- Solution: With BI Pixie you gain back control on usage and engagement. You can measure clicks on elements of the embedded reports like bookmark and slicer clicks. You can even see what end-users filter and where they drill-through for more details. It is a game-changer. You can finally know where to invest to optimize value for your customers with the web app.
Data Governance And Next-Gen Auditing
- Scenario: Your team delivers analytic services to the government or other organizations where data security and compliance are the #1 priority.
- Challenge: Following a misconfiguration of row-level security in Power BI you were asked to deliver new auditing capabilities to mitigate future data breaches. You are asked to notify when certain teams gain access to confidential information that belongs to other departments. In addition, you are asked to identify anomaly in user behaviors in your dashboards. Existing auditing options don't go deep enough, and you know that without proper controls, your Power BI project may be defunded.
- Solution: With BI Pixie you deliver (in days) a robust monitoring tool that tracks user activity and alerts anomalies. Your solution becomes the envy of your colleagues. They seek your leadership as they are now required to deliver the same level of auditing capabilities in their BI solutions.
How it works
Three steps to actionable insights
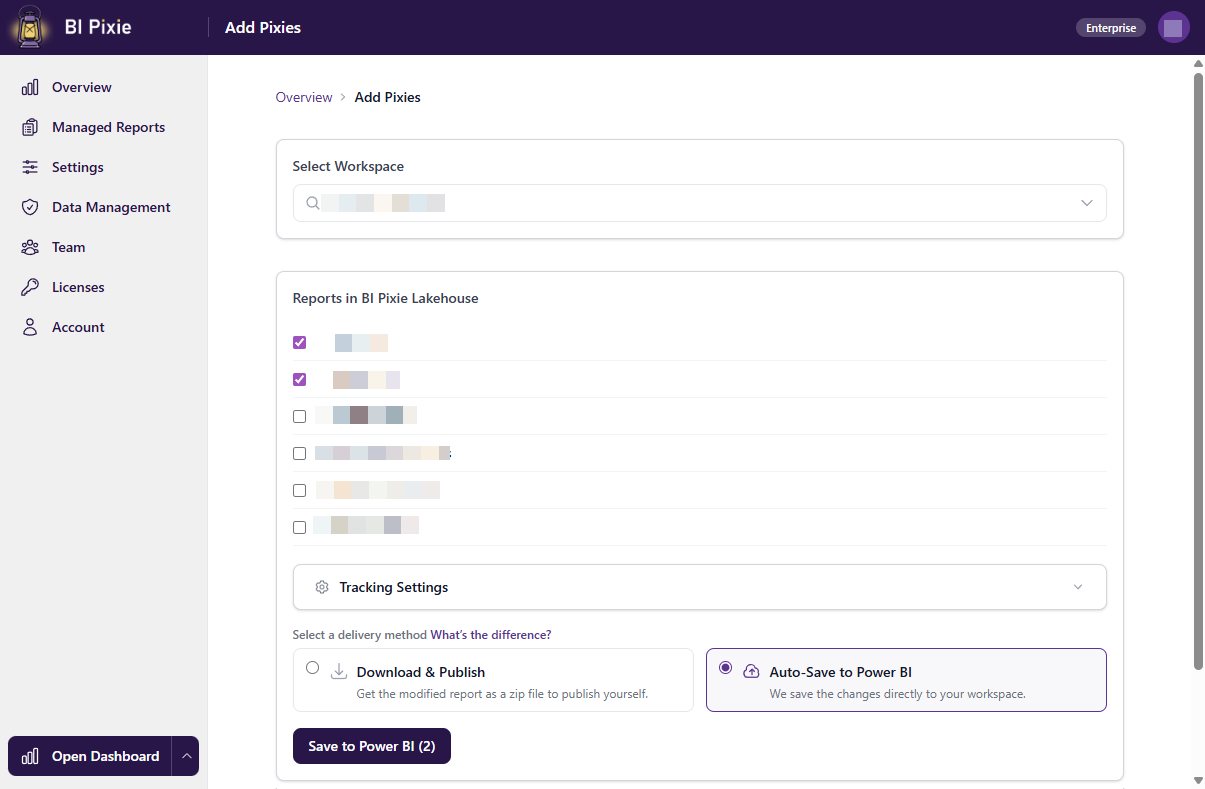
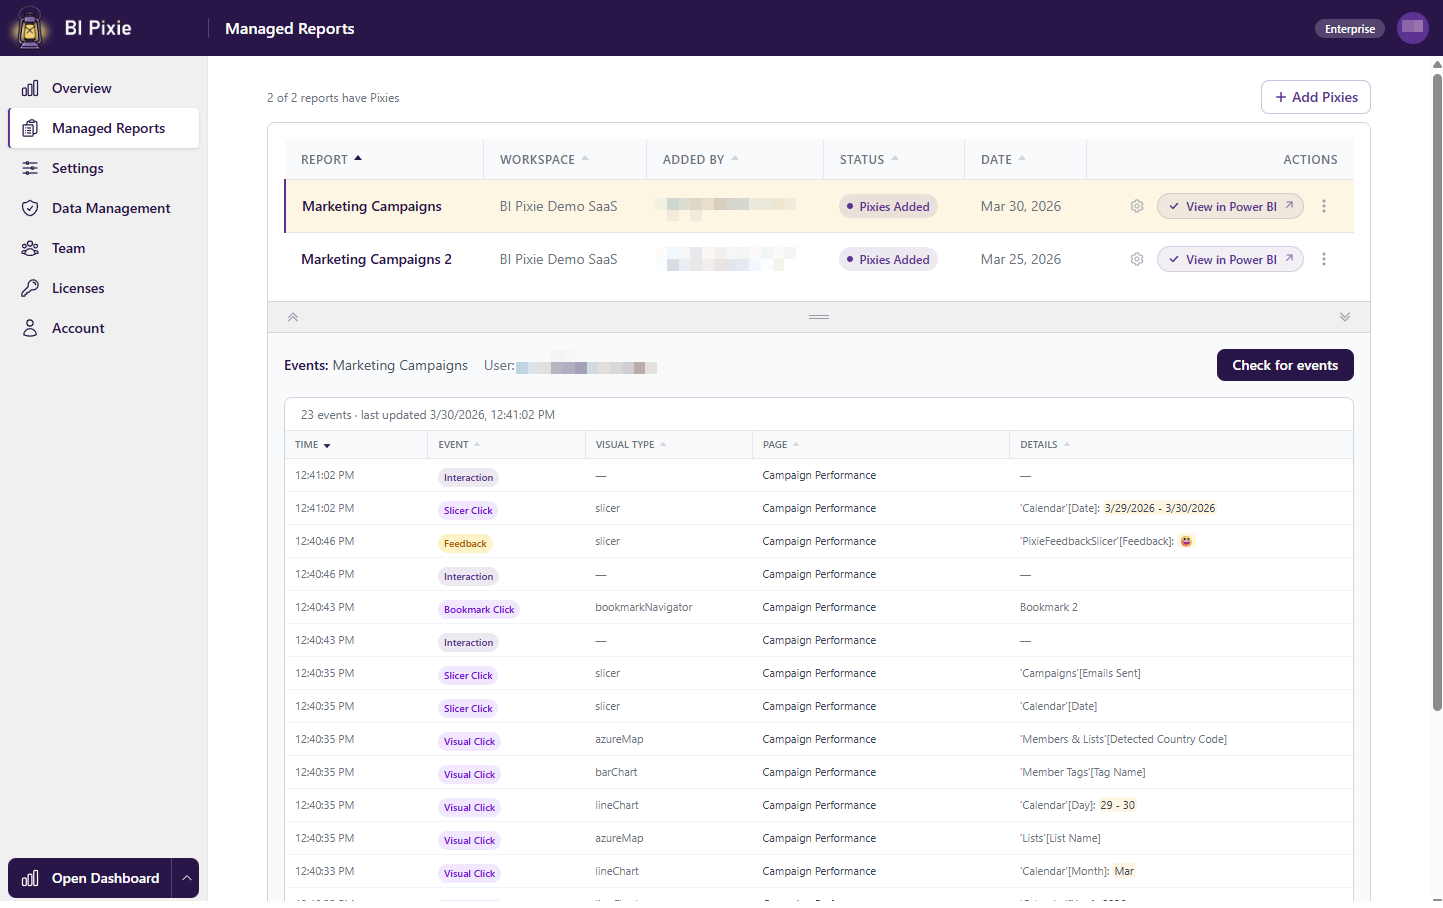
Add Pixies to your reports
BI Pixie scans your Power BI Reports and Semantic Models and adds invisible, native Power BI elements (Pixies) that track usage and engagement of your end-users.
Users interact normally
As users open, click, filter, and explore your reports, BI Pixie captures every interaction silently in the background. No matter where you publish the reports.
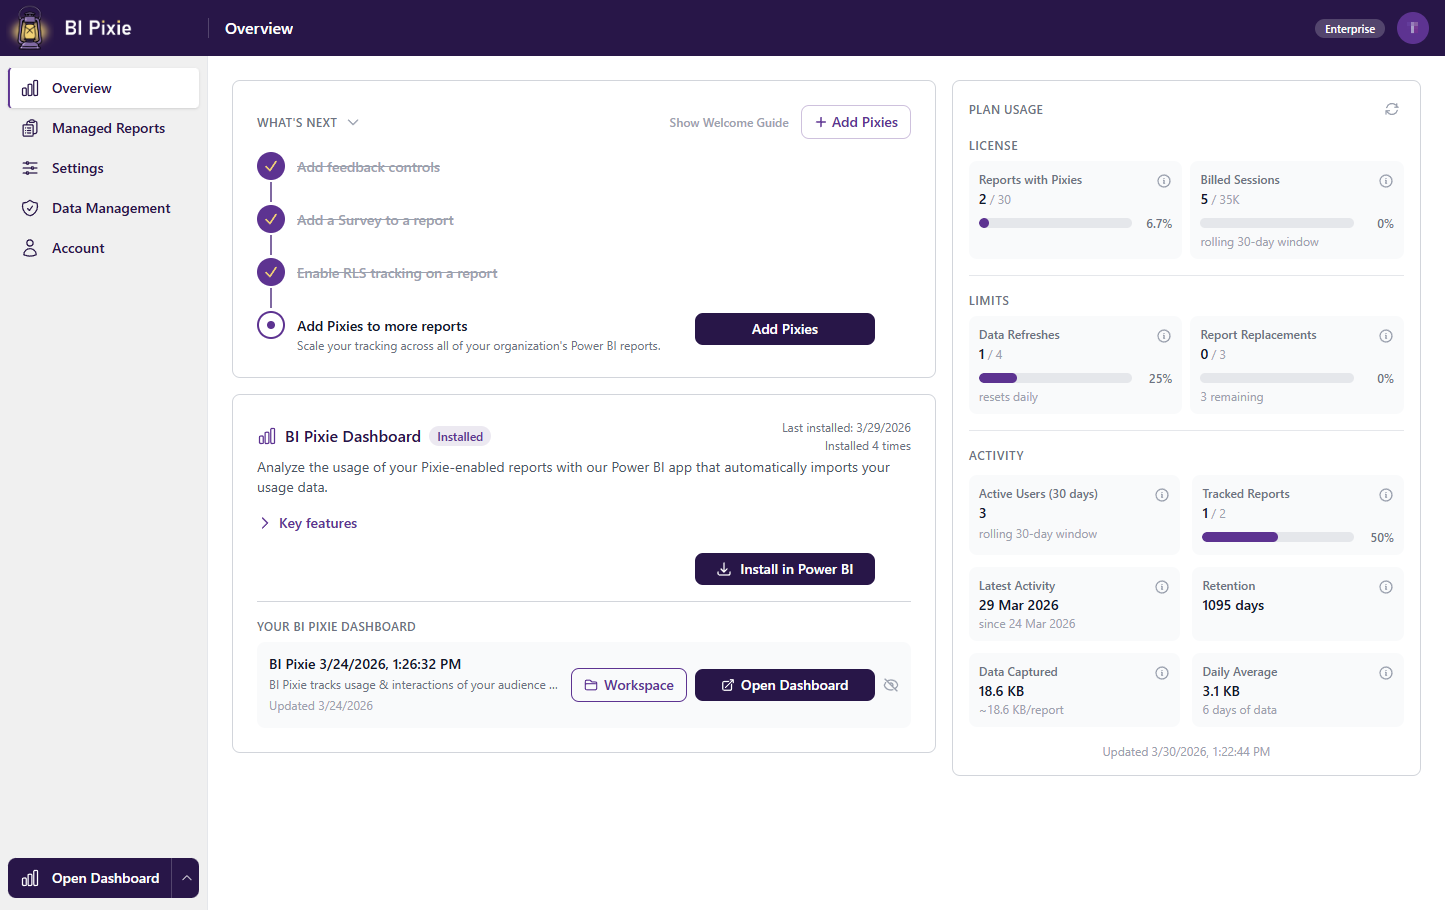
Analyze in the Dashboard
BI Pixie Analytics is a Power BI App that analyzes and visualizes the vast data that you collect from your Power BI portfolio with BI Pixie.
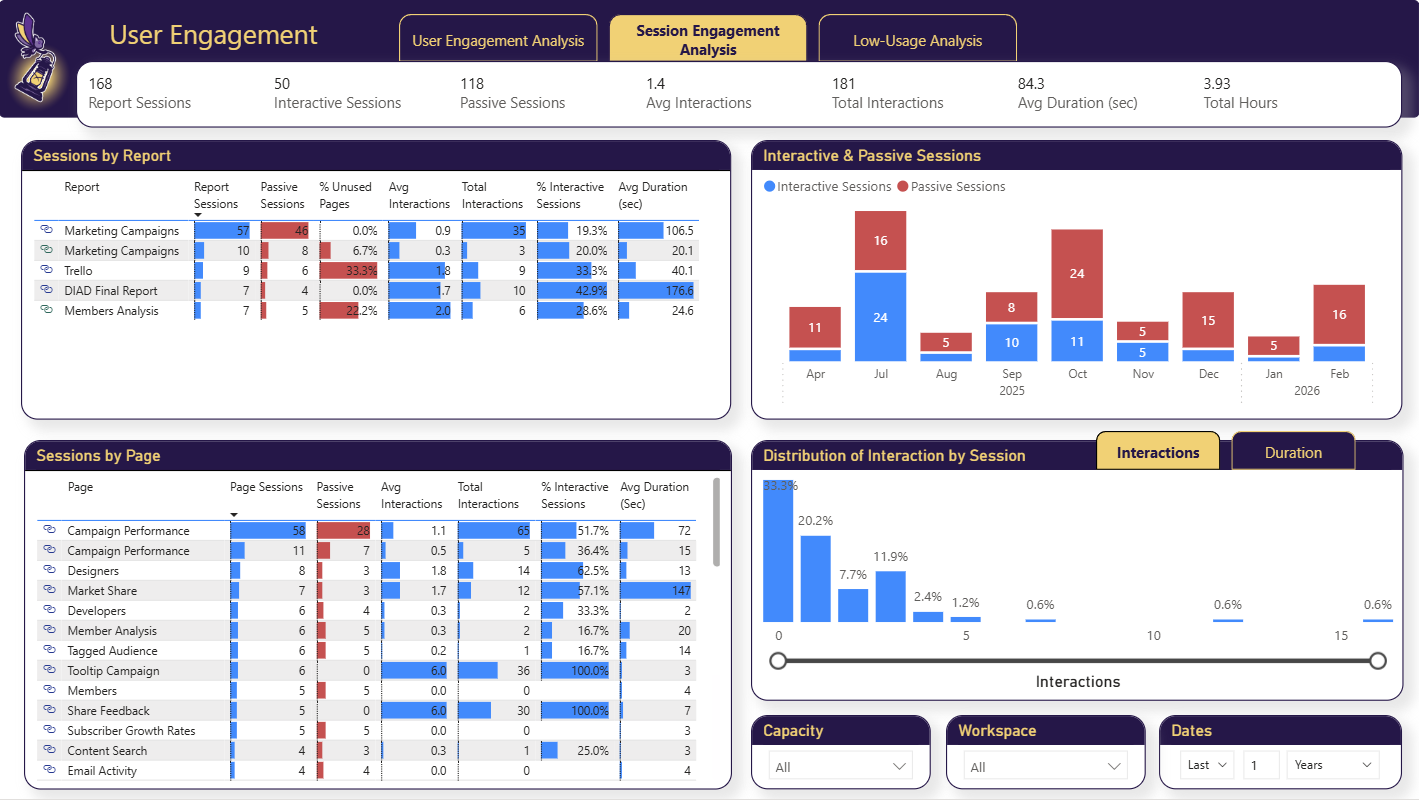
Measure engagement like a pro
Get comprehensive analytics capability to measure engagement, adoption, attrition, user satisfaction and performance at the visual or capacity level. Analyze how users engage with your Power BI reports and for how long. Measure engagement statistics at the report and page session level. Combine metrics with time-intelligence to measure your Power BI portfolio like a pro.
Deployment
Choose how you deploy
From zero-setup cloud to full self-hosted control. Every option is secure by default, with encryption, isolated storage, and compliance built in. You choose where your data lives.
BI Pixie Cloud
Start in 5 minutes. No infrastructure to deploy. We host everything. Connect your Power BI reports and start tracking immediately.
BI Pixie on Azure
Deploy in your own Azure subscription. Full data residency, your security policies, your compliance requirements. Enterprise-grade.
BI Pixie on Power Platform
Lightweight deployment using Dataverse and Power Automate. Ideal for teams already invested in the Microsoft Power Platform ecosystem.