Collect User Feedback Pro
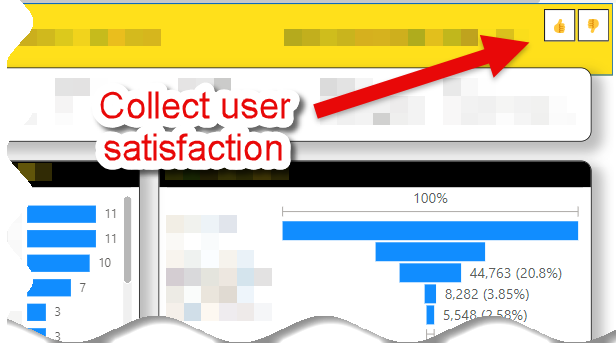
With BI Pixie you can collect user feedback from your BI audience and analyze user satisfaction. Combining engagement data with user satisfaction gives you a powerful lens to optimize the effectiveness of your BI portfolio. BI Pixie offers two ways to gather feedback: lightweight feedback controls for quick thumbs-up/down reactions, and embedded surveys for structured responses such as NPS scores and business value ratings. This guide covers the feedback controls. You can use either or both on the same reports.
How Does It Work?
Power BI does not include built-in controls for collecting user feedback directly inside reports. There is no native way to ask your audience whether a report is helpful, which pages they value most, or how their experience could be improved.
BI Pixie fills this gap. With a single toggle in the BI Pixie Portal, you can add feedback controls to any tracked report. Your report consumers see a lightweight set of icons — such as thumbs up and thumbs down — and can share their opinion with one click, without leaving the report.
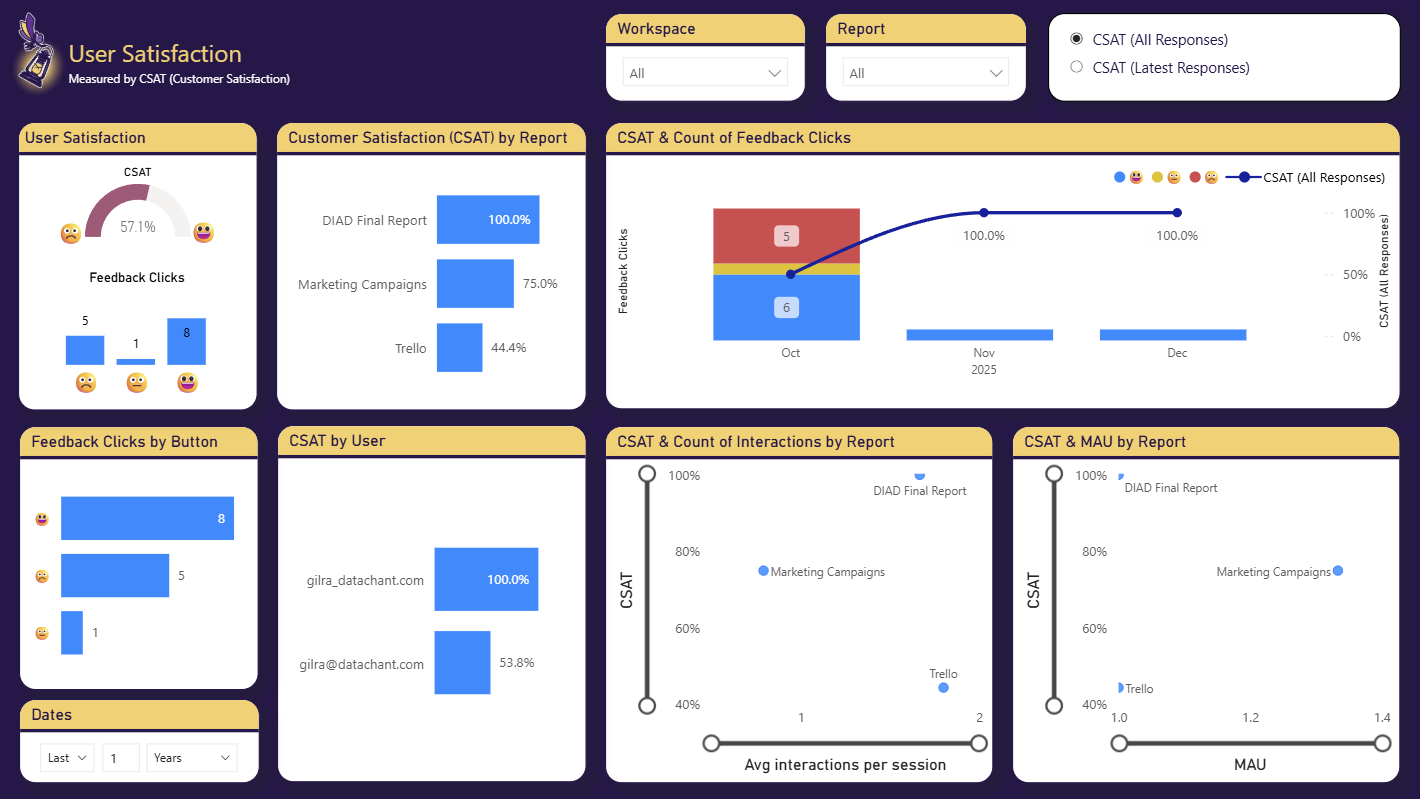
Every feedback response is captured automatically and available in the BI Pixie Dashboard. You can analyze satisfaction trends across reports, pages, and users — giving you a clear signal to guide where your BI investment has the most impact. No development work, no custom visuals, and no changes to your data model are required to get started.
The Feedback Control
When feedback collection is enabled, BI Pixie adds a feedback control to your target reports. The control consists of three buttons:
- A positive button (e.g., thumbs up or smile)
- A neutral button (e.g., a neutral face or hand icon). This option is hidden by default to elicit non-neutral user opinion.
- A negative button (e.g., thumbs down or frown)
You can show the neutral icon by turning off the Hide neutral icon setting in the Advanced section of Add feedback controls in Settings, if you prefer a three-button layout.
When a report consumer clicks one of the buttons, the feedback event is sent to BI Pixie. The same user can submit feedback multiple times. In BI Pixie Dashboard, you can analyze satisfaction by counting the last feedback per user or all clicks over time.
Feedback Modes
The feedback control is available in two modes:
| Mode | How It Works | Best For |
|---|---|---|
| All Pages (Slicer) | A feedback slicer appears on every page of the report. Users can provide different feedback per page. | Page-level satisfaction analysis. Higher discoverability as the feedback control appears on every page. |
| One Page (Bookmark Navigator) | A bookmark navigator control appears on one page only (first page by default). | Overall report satisfaction. Also required when working with thin reports where you don't have Contributor access to the semantic model. If you select All Pages but the semantic model is not available when the Pixies are added, BI Pixie will automatically fall back to this mode. |
Enable Feedback Collection
- In the BI Pixie Portal, navigate to the Settings page.
- Select the level where you want to enable feedback: Tracking Setup (account-wide), a specific workspace, or a specific report in the hierarchy sidebar.
- Scroll to the Add feedback controls section and toggle it on.
- Choose the icon style:
- Thumbs Up / Thumbs Down
- Smile / Frown
- Custom emoji (enter your preferred characters)
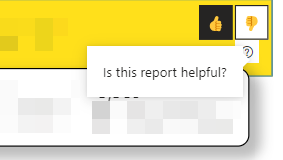
- Set the tooltip text (e.g., "Is this report helpful?" or "Is this page helpful?"). The tooltip appears when your audience clicks the help icon on the feedback control:
- Choose whether to add feedback to all pages or a single page. If single page, set the Show feedback on page number field.
- Optionally expand the Advanced section. Optimize bookmark navigators is on by default and we recommend keeping it enabled. When your reports have ungrouped bookmarks, the feedback bookmarks could appear in existing Bookmark Navigator controls. With this option enabled, BI Pixie automatically groups any ungrouped bookmarks and assigns them to existing Bookmark Navigators, keeping the feedback bookmarks isolated in their own control.
- Click Save settings.
- Go to the Add Pixies page and update Pixies on the affected reports to apply the feedback controls.
Position Considerations
BI Pixie places the feedback control at the top-right corner of the target pages. If it overlaps with existing visuals, we recommend that you move the conflicting visuals from the top-right corner of your reports. Alternatively, you can move the BI Pixie feedback control after it was added. Subsequent updates of the Pixies from the Managed Reports page of the BI Pixie Portal will maintain the new position of the feedback control.
Important Notes
- When using the All Pages (Slicer) mode, BI Pixie adds a hidden calculated table to the semantic model. If this is the first time you add the feedback control, you will need to refresh the schema of your semantic model after you add the Pixies.
- If your report uses a live connection to an external semantic model, the feedback mode will fall back to the Bookmark Navigator on one page (unless the external model already contains the required table).
- To change feedback settings on reports that already have Pixies, update the settings, save, and then use Update Pixies on the affected reports.
Related Resources
- Settings — Configure feedback controls and other tracking settings.
- Add Pixies to Your Reports — Apply your feedback settings by updating Pixies.
- Managed Reports — View feedback events from your tracked reports.
What's Next
- Embed User Surveys — Add NPS and business value surveys to your reports.