Set up BI Pixie Dashboard
BI Pixie Dashboard is a Power BI app that connects to your BI Pixie data and provides rich analytics to understand how your audience engages with your Power BI reports. See BI Pixie Dashboard for a walkthrough of all the available pages and insights.
Setting up the dashboard takes about two minutes. You install it from the BI Pixie Portal, connect it to your data in Power BI, and you are ready to go.
The dashboard is a separate Power BI app rather than part of the BI Pixie Portal because it runs inside Power BI itself. This gives you the full Power BI experience: you can customize visuals, add your own pages, apply filters, share with colleagues, and schedule automatic data refreshes. The imported data in the BI Pixie semantic model stays inside your own Power BI environment. This means you can build your own reports on top of it, and use Copilot and AI agents to query your usage data using natural language.
Step 1: Install from the Overview Page
- Sign in to the BI Pixie Portal and go to the Overview page.
- In the BI Pixie Dashboard card, click Install in Power BI. This opens Power BI Service in a new tab.
- In Power BI, choose a name for the new workspace that will be created for the app. By default it is named "BI Pixie" followed by the installation date. Confirm the installation.
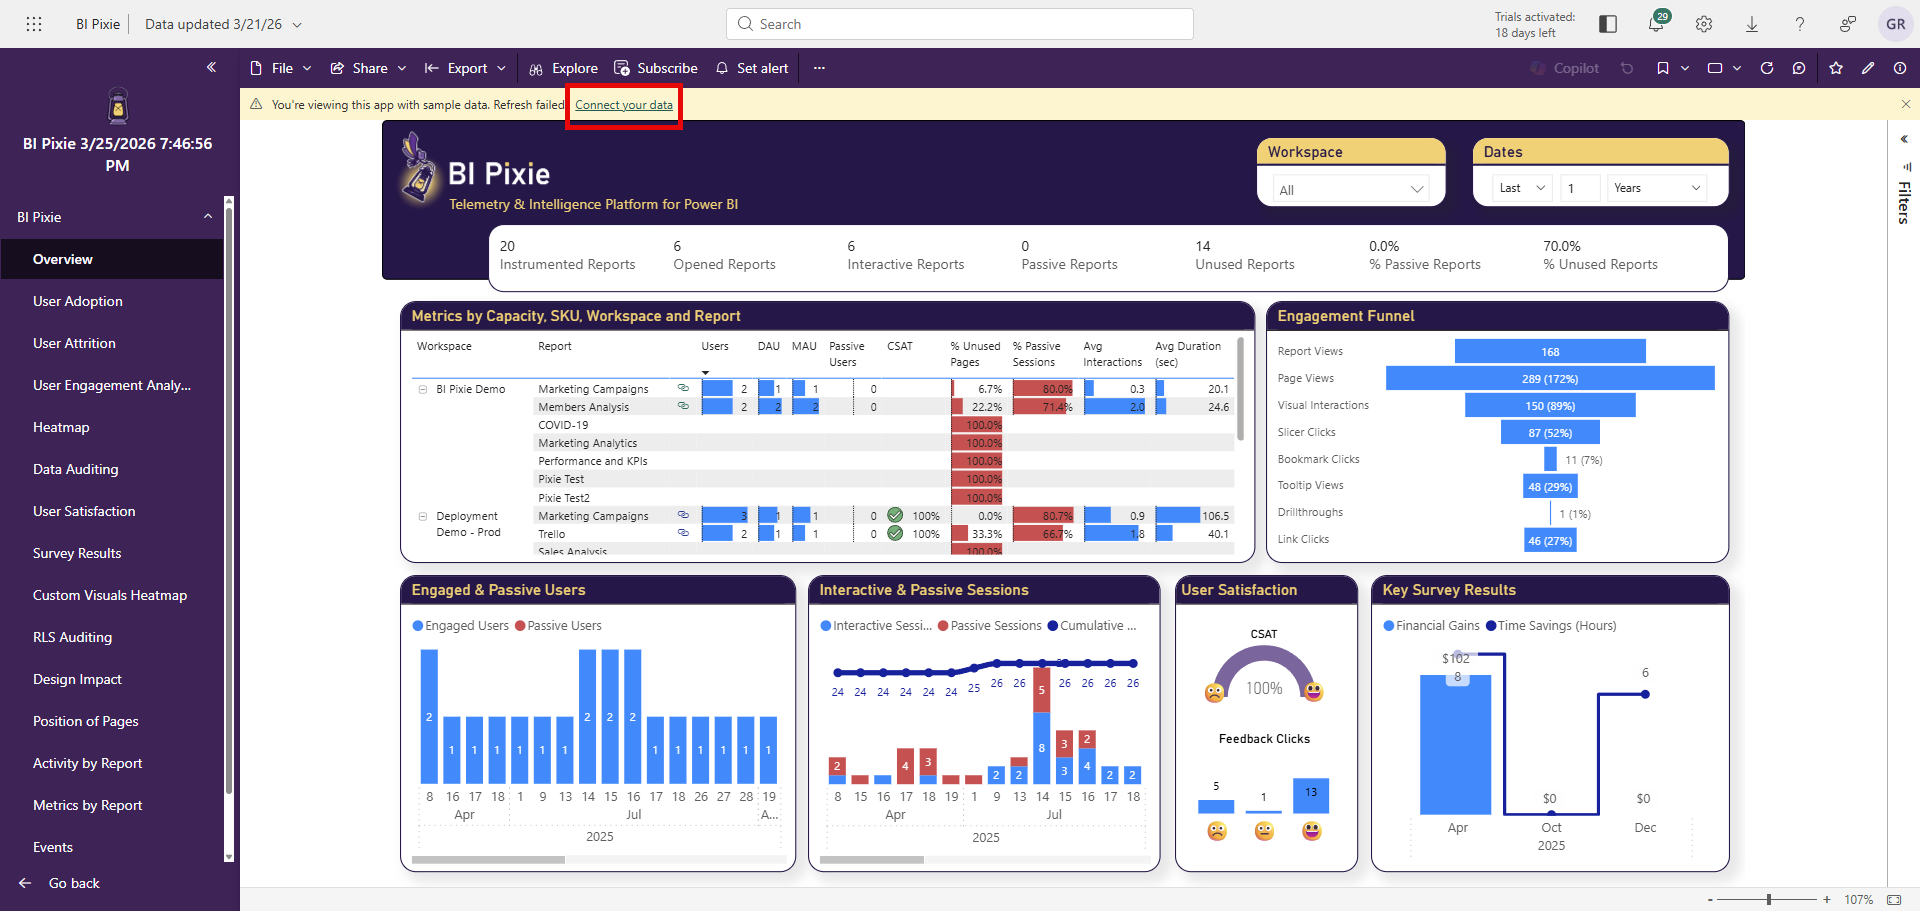
- The app opens automatically with sample data so you can explore the dashboard pages right away.
Step 2: Connect to Your Data
After installation, the dashboard shows sample data. Click the Connect your data link in the yellow banner at the top to connect to your own BI Pixie data.
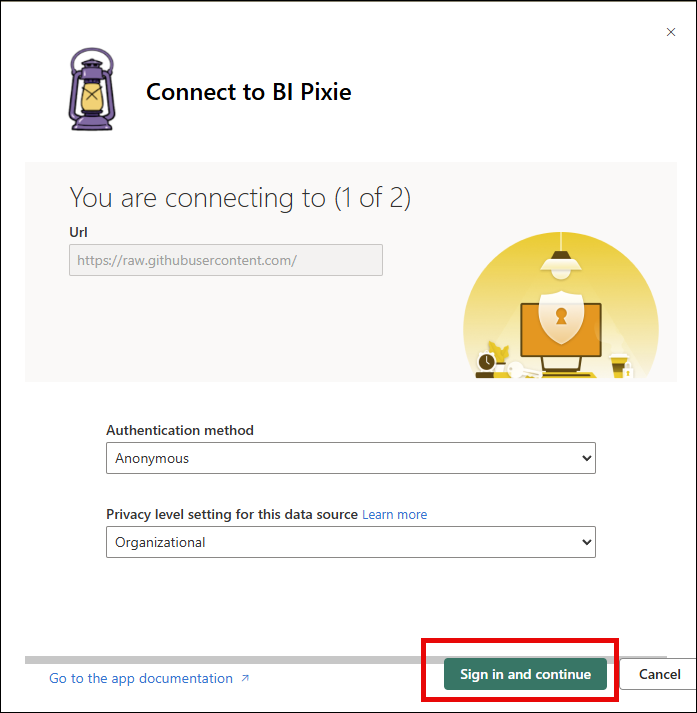
The connection wizard has two steps. The order of the steps may vary depending on your Power BI environment:
Step 1 of 2: The URL parameter is pre-filled when you install from the BI Pixie Portal. Set the Authentication method to Anonymous and the Privacy level to Organizational. Click Sign in and continue.
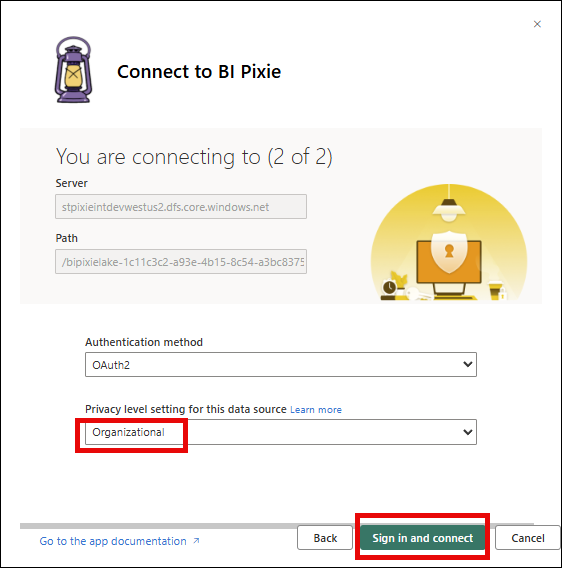
Step 2 of 2: The Server and Path fields are pre-filled from the URL. Set the Authentication method to OAuth2 and the Privacy level to Organizational. Click Sign in and connect.
Power BI will now refresh the semantic model and connect to your data. This may take a few minutes depending on your data volume.
Step 3: Set Up Scheduled Refresh
To keep your dashboard up to date with the latest engagement data, configure a scheduled refresh in Power BI:
- In the Power BI workspace where you installed the app, find the BI Pixie semantic model.
- Click the three-dot menu and select Settings.
- Expand the Refresh section and toggle Scheduled refresh on.
- Set the refresh frequency. A daily refresh is suitable for most teams. Note that your BI Pixie plan includes a daily refresh limit, which you can monitor on the Account page under Data Refreshes. See the FAQ for more details on refresh limits and troubleshooting.
- Click Apply.
Note: Workspaces with a Power BI Pro license support up to 8 refreshes per day. For more frequent refreshes or large data volumes, use a Power BI Premium or Fabric capacity. See Microsoft's data refresh documentation for details.
Opening the Dashboard from the Portal
Once the dashboard is installed, the BI Pixie Portal can detect it and provide quick access. On the Overview page, in the BI Pixie Dashboard card, click the Grant access button. This grants BI Pixie permission to discover your installed Power BI apps (using the App.Read.All scope on the Fabric API) so it can find your BI Pixie Dashboard installations.
After granting consent, your installed dashboard appears in the Overview card with an Open link. An Open Dashboard button also appears in the portal sidebar for quick access from any page.
If you have multiple BI Pixie Dashboard installations (for example, in different workspaces), all of them will appear in the Overview card. You can hide installations you no longer need from the action menu.
When would you want multiple installations?
- Version management: Keep different versions side by side, especially if you customize the BI Pixie Dashboard. This lets you test how your custom reports connect to a new version of the semantic model before switching over.
- Team-level customizations (Standard and Pro): Multiple team members can install their own instances of the dashboard with different filters and customizations. Since all members can access the shared data container, you can manage who sees what by controlling access to each workspace.
- Dedicated licenses (Enterprise): When you allocate separate licenses to different team members, the first assigned member in each license should install the BI Pixie Dashboard from the Overview page. It connects to that license's dedicated data container. The member can then share the Power BI workspace with other members assigned to the same license.
Updating the Dashboard
When a new version of BI Pixie Dashboard is available, the Overview page will display an Update in Power BI button in the dashboard card. Click it to begin the update process.
Power BI will present three options for how to apply the update:
- Update the workspace and the app: Overwrites both the workspace content and the published app with the new version. Your data connections and authentication are preserved, and an automatic refresh starts after the update. Choose this if you have not customized the dashboard.
- Update only workspace content without updating the app: Updates the reports, dashboards, and semantic model in the workspace, but does not republish the app. This lets you review the changes first and decide what to include before you manually update the app. Choose this if you have customizations you want to merge carefully.
- Install another copy in a new workspace: Installs a fresh version in a new workspace without changing your current installation. Choose this if you want to keep your existing dashboard as-is and test the new version side by side.
For more details, see Microsoft's template app update documentation.
If the dashboard needs to be reinstalled (for example, after deleting the workspace), click Reinstall in Power BI on the Overview page to start a fresh installation.
Customizing the Dashboard
BI Pixie Dashboard is a Power BI template app. This means you can customize it to fit your needs:
- Edit existing pages: Open the app workspace in Power BI, find the report, and edit visuals, colors, or layouts to match your organization's style.
- Add new pages: Create additional report pages with custom visuals or KPIs specific to your team.
- Create thin reports: Build new Power BI reports that connect live to the BI Pixie semantic model, giving you full flexibility without modifying the original dashboard.
- Create new measures: Add DAX measures in the thin report for custom calculations.
- Share with your team: Publish the app within your organization so stakeholders can access engagement insights without needing BI Pixie Portal access.
For more information on working with Power BI template apps, see Microsoft's template apps overview and install and distribute template apps.
Troubleshooting
Cannot install the template app: If the Install in Power BI button opens Power BI but the installation is blocked, your Power BI admin may have disabled template app installations for your tenant. Contact your Power BI administrator and ask them to enable the template app settings in the Power BI admin portal.
If you need further help, contact support.
What's Next
- BI Pixie Dashboard — A walkthrough of all dashboard pages and the insights they provide.
- BI Pixie Metrics — A reference of all metrics available in the dashboard.
- Use Heatmap — Enable visual-level click tracking and view heatmaps.