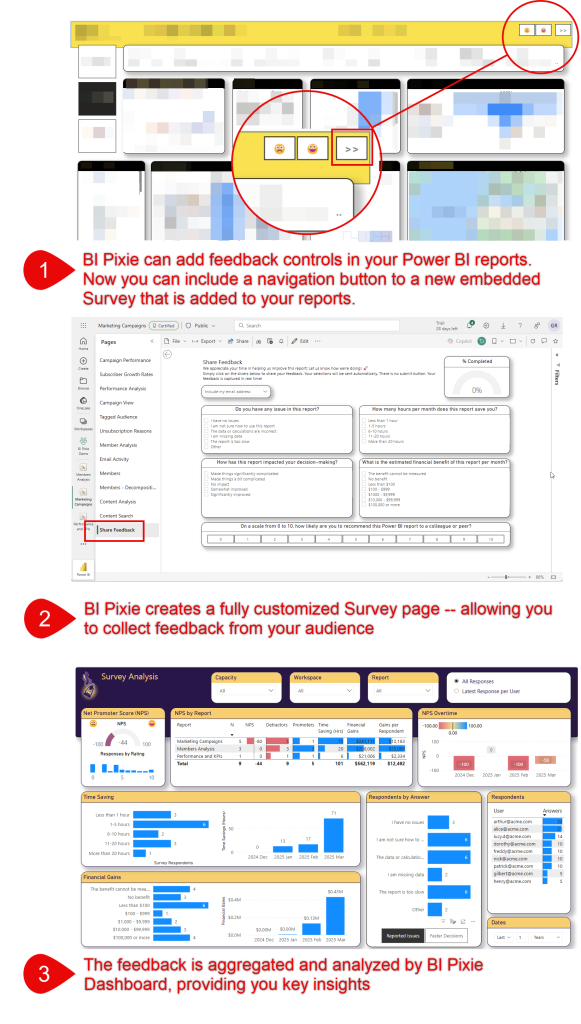
With BI Pixie you can embed surveys in your target Power BI and collect feedback from your BI audience. In this article, you will learn how to configure BI Pixie Instrumentation to embed the survey in your target reports.
The Survey Page
The embedded survey page is a native Power BI page that BI Pixie Instrumentation can instrument into your target reports. The survey page consists of built-in slicers that contain customized questions and answers and can help you learn the following about your end-users:
- How likely are the end-users to recommend the reports to colleagues. BI Pixie Dashboard will calculate the NPS (Net Promoter Score) based on the answers from the respondents.
- What is the estimated financial benefit of the report per month?
- How much time is saved by the end-users thanks to your reports?
- Are decisions faster or slower?
- What are the main technical issues end-users experience?
Setting Up The Embedded Survey
Open BI Pixie Instrumentation's target folder (by default it's where you have bi-pixie.exe). If you don't have the two configuration files bi_pixie_config.json and bi_pixie_config_details.json, follow this article.
To embed the Survey page as the last page of your target reports and begin collecting respondents' answers using the same survey, open the global configuration file, bi_pixie_config.json.
To collect user feedback in specified reports only, or to customize the survey for specific reports, open bi_pixie_config_details.json.
Important Note: If you already activated the embedded survey and instrumented your reports, any further changes in the settings of the surveys will require first to clean the reports by running the instrumentation in clean_only mode using the following settings:
"clean_only": trueWhen you complete the instrumentation, change the settings as described in this section, and then set clean_only to false before you instrument the target reports again.
Enable The Embedded Survey
Since the embedded survey is disabled by default, the first step is to activate it. Set the survey_enabled field to true under the collect_survey_feedback parameter:
"collect_survey_feedback": {
  "survey_enabled": true,
  ...
}
Now, if you are good with the default settings of the survey, you are ready to go. Run the instrumentation with the new settings and BI Pixie will add the new page in your target report.
Customizing the Survey
The following screenshot highlights all the elements you can customize in the embedded survey.
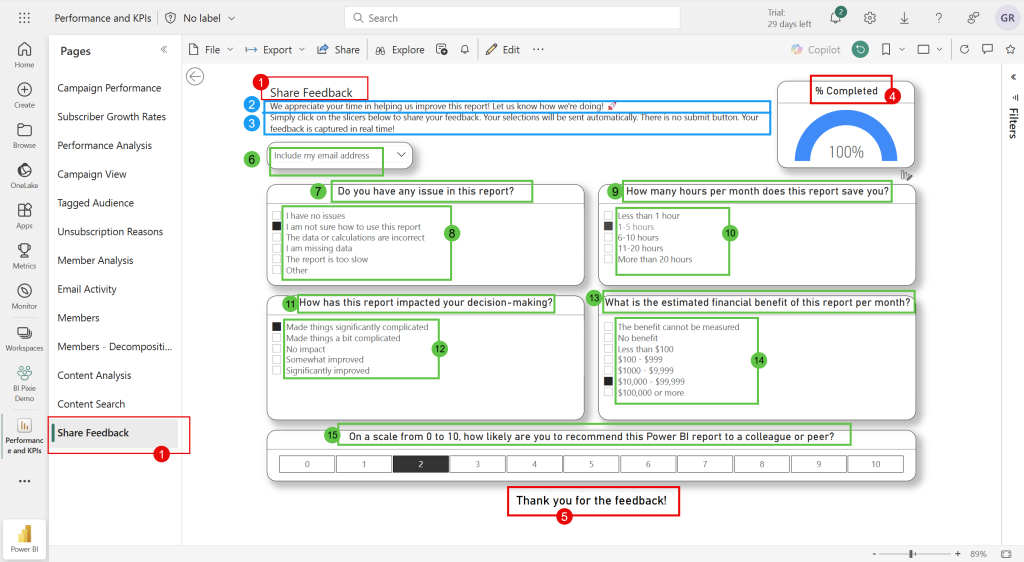
Page name and Header title (Element 1)
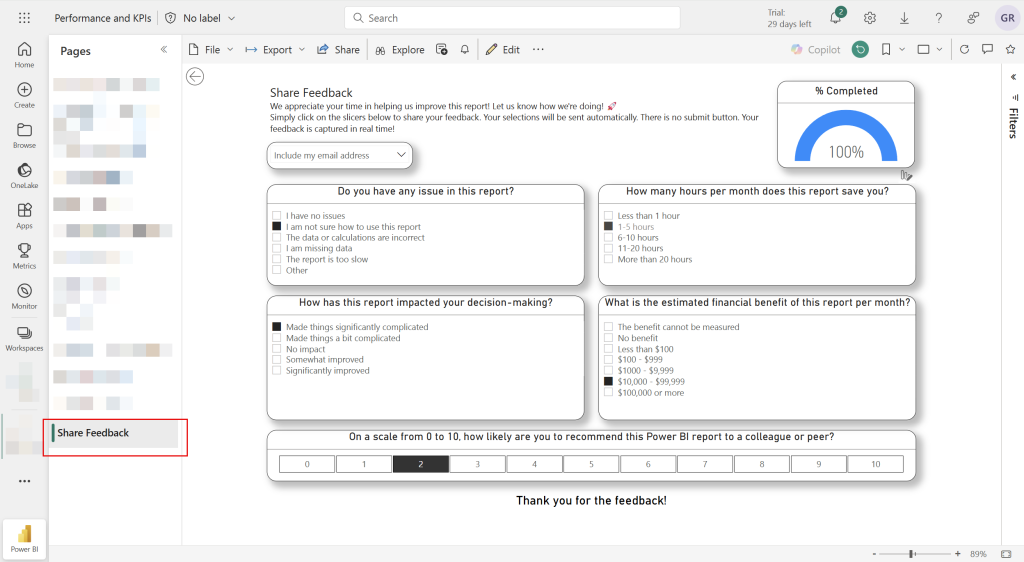
The embedded survey is added as the last page of the target reports. By default, the Survey's page name is "Share Feedback". You can customize it by updating the value of the survey_page_title field below. The same label will be used as the title at the header of the page.
"collect_survey_feedback": {
  ...
  "survey_page_title": "Share Feedback",
  ...
}
Survey description and instructions (Elements 2 & 3)
The header of the page includes two sentences. To customize the first sentence change the value of the parameter survey_page_description. To customize the second sentence change the value of the parameter survey_page_instructions
"collect_survey_feedback": {
  ...
  "survey_page_description": "We appreciate your time in helping us improve this report! Let us know how we're doing!",
  "survey_page_instructions": "Simply click on the slicers below to share your feedback. Your selections will be sent automatically. There is no submit button. Your feedback is captured in real time!",
  ...
}
Progress gauge (Element 4)
At the top right of the survey page, a gauge shows the end-users their progress. At the beginning before any answer is provided, the gauge will be at 0% and will be at 100% when all the questions are answered. By default the label is "% Completed". To customize the label, update the survey_progress_gauge_title parameter.
"collect_survey_feedback": {
  ...
  "survey_progress_gauge_title": "% Completed",
  ...
}
Thank you label (Element 5)
When all the questions are answered, the gauge will show 100% and a Thank You label will appear at the footer of the survey. By default the label is "Thank you for the feedback!". To customize the label, update the survey_thank_you_title parameter.
"collect_survey_feedback": {
  ...
  "survey_thank_you_title": "Thank you for the feedback!",
  ...
}
User identification (Element 6)
The first question in the survey allows the end-user to decide if they agree to share feedback with their email address or to keep their responses anonymous. The default options are:
- Include my email address
- Stay anonymous
Issues Question (Elements 7 & 8)
The second question in the survey asks the end-users which technical issues they have. The settings for that question are under the issues_question object. To disable this question, set enabled parameter to false.
"collect_survey_feedback": {
  ...
  "issues_question": {
    "enabled": true,
    "question": "Do you have any issue in this report?",
    "answers": [
      ["I have no issues", 0],
      ["I am not sure how to use this report", 1],
      ["The data or calculations are incorrect", 2],
      ["I am missing data", 3],
      ["The report is too slow", 4],
      ["Other", 5]
    ]
  },
  ...
}
Time Savings Question (Elements 9 & 10)
The third question asks the end-users how many hours the report saves them. The settings are under the time_save_question object.
"time_save_question": {
  "enabled": true,
  "question": "How many hours per month does this report save you?",
  "answers": [
    ["Less than 1 hour", 0],
    ["1-5 hours", 1],
    ["6-10 hours", 6],
    ["11-20 hours", 11],
    ["More than 20 hours", 20]
  ]
},
Decision-Making Question (Elements 11 & 12)
The fourth question asks if the report impacts decision-making. Settings are under the decision_making_question object.
"decision_making_question": {
  "enabled": true,
  "question": "How has this report impacted your decision-making?",
  "answers": [
    ["Made things significantly complicated", -2],
    ["Made things a bit complicated", -1],
    ["No impact", 0],
    ["Somewhat improved", 1],
    ["Significantly improved", 2]
  ]
},
Financial Gain Question (Elements 13 & 14)
The fifth question asks about estimated financial benefit. Settings are under the financial_benefit_question object.
"financial_benefit_question": {
  "enabled": true,
  "question": "What is the estimated monthly financial savings or gain of this report?",
  "answers": [
    ["The benefit cannot be measured", -1],
    ["No benefit", 0],
    ["Less than $100", 1],
    ["$100 - $999", 100],
    ["$1000 - $9,999", 1000],
    ["$10,000 - $99,999", 10000],
    ["$100,000 or more", 100000]
  ]
}
Net Promoter Score (NPS) Question (Element 15)
The last question measures the likelihood to recommend the report to colleagues. Settings are under the nps_question object.
"nps_question": {
  "enabled": true,
  "question": "On a scale from 0 to 10, how likely are you to recommend this Power BI report to a colleague or peer?"
},
Navigation Experience
If you activated the Feedback Collection feature on all pages as described here, you can add a navigation button next to the Feedback slicer. End-users will be able to navigate from each page to the last page where the embedded survey is located.
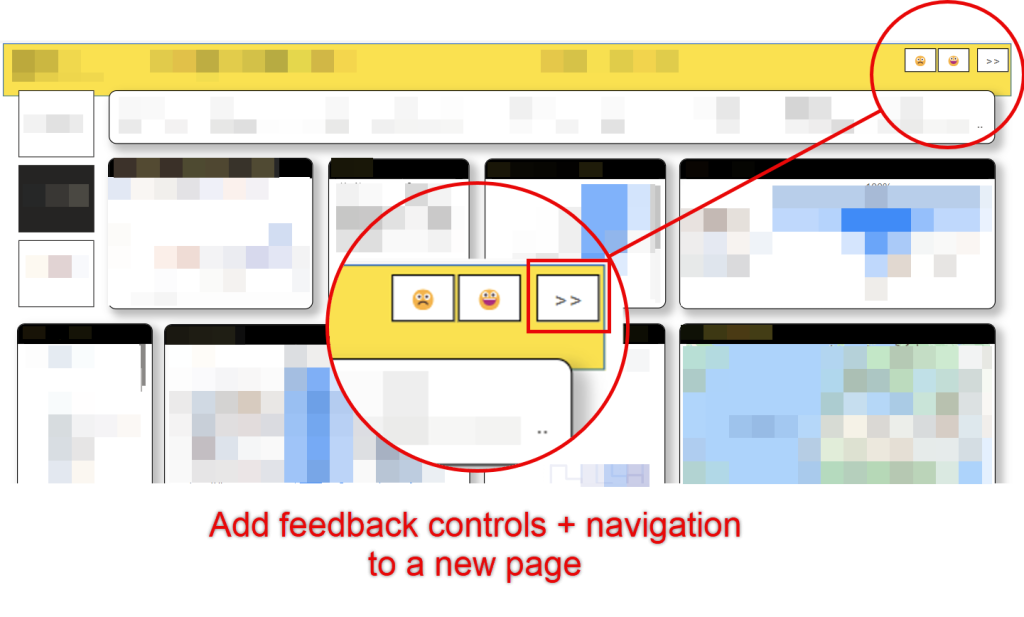
"collect_survey_feedback": {
  ...
  "include_button_to_survey": true,
  "include_button_to_survey_label": "Share feedback",
  ...
}
Special Considerations
The embedded survey is implemented using native Slicer visuals in Power BI. Each Slicer visual has the Survey's question as a title, and the answers as the values the end-users can select in the Slicer. The answers in each Slicer are sourced from a specific table that is added to the semantic model during BI Pixie instrumentation.
When you activate the embedded survey, BI Pixie adds 6 hidden calculated tables in the local Semantic Model of the target report (unless the report is connected live to an external Semantic Model that was not already instrumented with such tables):
- PixieFeedbackContactMe
- PixieFeedbackIssues
- PixieFeedbackTimeSavings
- PixieFeedbackDecisionImpact
- PixieFeedbackFinancialImpact
- PixieFeedbackNPS
Each table correspond to a specific question in the survey and is bound to a Slicer control in the survey page. Do not rename the tables or their column names. By renaming the tables or their column names, BI Pixie will lose the association of the specific slicers as questions in the survey and will create the new tables again.
When your target report has a live-connection to an external Semantic Model, the embedded survey page will not be added to the report unless the external Semantic Model already has the six tables above. You can add these tables to a shared Semantic Model by instrumenting the local report of the Semantic Model. If you convert your live-connection report to a Composite mode in Power BI, BI Pixie can add the six tables in the local Semantic Model, and the embedded survey can be added to your report.
What's Next
More configuration options for BI Pixie Instrumentation
Analyze engagement at the visuals level using a heatmap